Webinar: Energy Resilience: Lessons Learned from Clear Path IV and Cascadia Rising National Exercises

Fri, Nov 18, 2016 3:00 PM – 4:00 PM EST

Hear from state and federal officials regarding key issues and recommendations from energy-focused disaster response exercises held in 2016.

Panelists:
• Robert Ezelle, Director, Washington Emergency Management Division
• Deanna Henry, Oregon Department of Energy and ESF 12 Co-lead
• Jeff Baumgartner, Senior Advisor, Infrastructure Security and Energy Restoration, DOE

Webinar co-sponsored by NEMA and U.S. Department of Energy

To register for the free webinar, sign up here.

HUD proposes new resilience standard

“In the face of increased flooding risks and rising sea levels, the U.S. Department of Housing and Urban Development (HUD) today proposed new elevation standards for all HUD-supported properties.  For the first time in nearly 40 years, HUD is proposing to establish higher elevation requirements for properties seeking HUD assistance or Federal Housing Administration (FHA) mortgage insurance. The Proposed Rule is on display for Public Inspection and will be published tomorrow. Public comment will remain open until December 27th, 2016.”

·       Press Release (a copy of the release will be posted here shortly)

·       HUD Summary Website

·       Federal Register

Resource: APA publishes “Subdivision Design and Flood Hazard Areas”

From the APA Interact newsletter: “Sustainability, resilience, and climate change are top of mind for planners and floodplain managers, but when it comes to subdivision design, those concepts haven’t hit home. The result? Catastrophic flood damage. Subdivision Design and Flood Hazard Areas is a guide to best floodplain planning practices for subdivision design. Readers will find tools to end the build-damage-rebuild cycle, save lives, protect property, and lay the foundation for a better, drier future. Thanks to funding from FEMA, this PAS Report is available as a free download or for purchase in print from APA Books.”

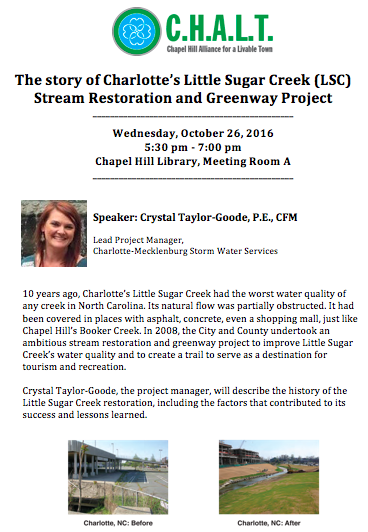
Event: Upcoming lecture on stream restoration of Charlotte’s Little Sugar Creek

Wednesday, October 26 at 5:30 PM – 7 PM
Chapel Hill Public Library – Meeting Room A
screen-shot-2016-10-20-at-2-15-31-pm
Ten years ago, Little Sugar Creek in Charlotte had the worst water quality of any creek in North Carolina. Its natural flow was partially obstructed. It had been covered in places with asphalt, concrete, even a shopping mall, just like Chapel Hill’s Booker Creek. In 2008, the City and County undertook an ambitious stream restoration and greenway project to improve Little Sugar Creek’s water quality and to create a trail to serve as a destination for tourism and recreation.

Crystal Taylor-Goode, the project manager, will describe the history of the Little Sugar Creek restoration, including the factors that contributed to its success and lessons learned.

Resource: Climate Central’s updated Surging Seas Risk Finder

Courtesy of Climate Central’s email announcement:

Sea level rise traceable to human-caused global warming is already increasing coastal floods. This week Climate Central released a new module within Surging Seas Risk Finder, our interactive data toolkit for the coastal U.S. (to be expanded internationally in 2017).

“Coastal Floods Are Increasing” uses analysis from our report quantifying the contribution of human-induced sea level rise to “minor” floods as defined by the National Weather Service. These are the increasingly frequent events that can block traffic, degrade infrastructure, and cause a multitude of problems in daily life, even on sunny, storm-free days. The tool charts trends for places within 100 miles of tide gauges analyzed in the study.

Two-thirds of all floods in the U.S. since 1950 — and more than 75% in the last decade — are directly attributable to sea level rise caused by the burning of fossil fuels. Here’s an example from Risk Finder of the decade-by-decade look for Annapolis, MD.

Reducing Your Risk

We also provide an up-to-date tally of the flooding that’s occurred since the beginning of 2015, based on localized data from 27 tide stations. The example below is for New York City.

Reducing Your RiskExplore the risk for your area by searching for your location at riskfinder.org.